Users can now view the performance of individual catalogs and products in those catalogs in the new Catalog Analytics module.
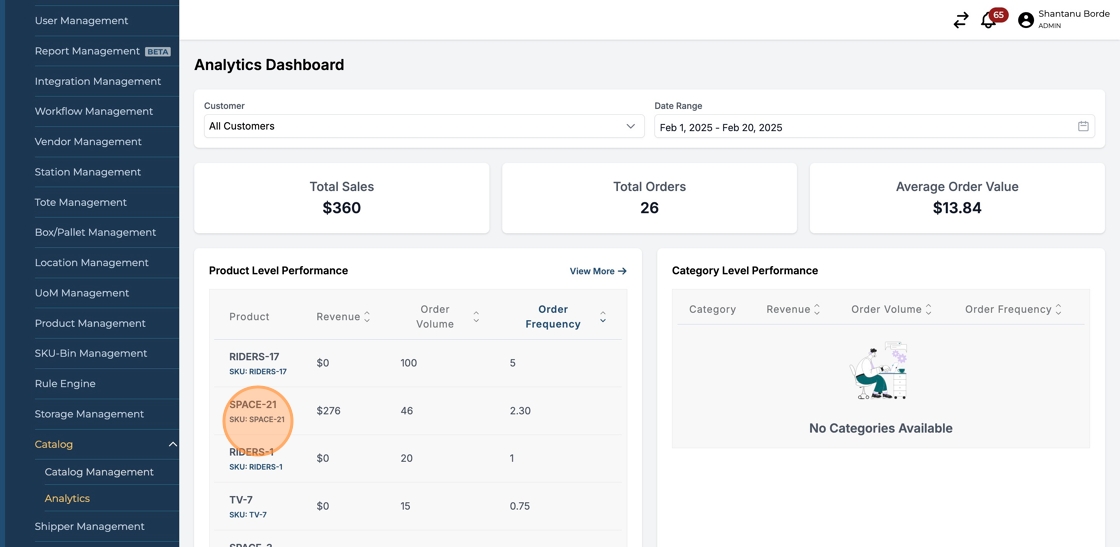
The Catalog Analytics module home page displays:
-
Total Sales
-
Total Orders
-
Average Order Value
-
Product Performance according to Revenue, Order Volume and Order Frequency
-
Revenue trend
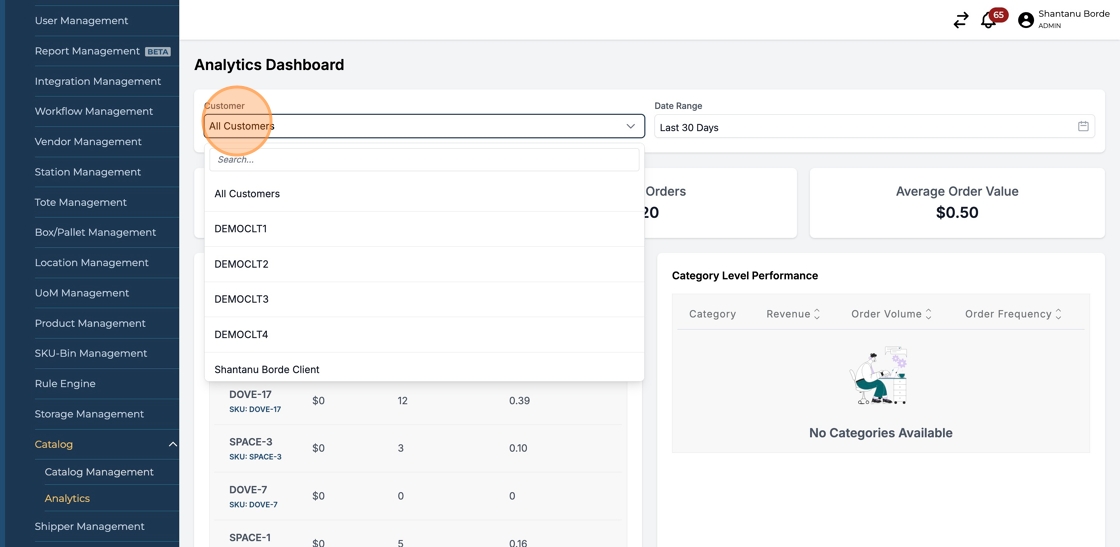
These metrics can be further analysed with relevant features like Catalog and Date Range. The users can also compare the metrics from two different time periods with the comparison feature.
Please go through the below guide to learn how to navigate the Catalog Analytics module.
-
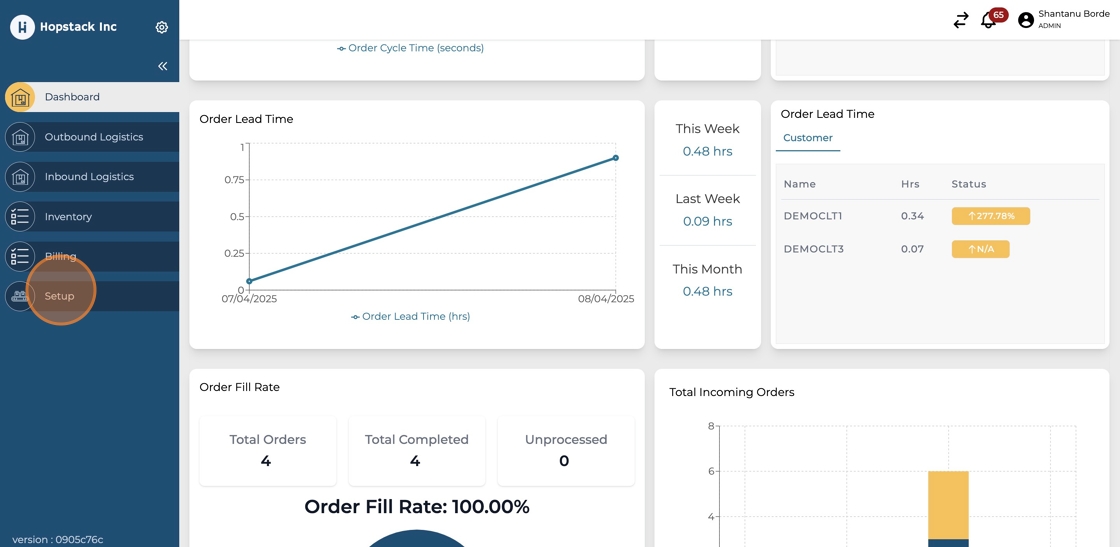
Navigate to the Hopstack platform
-
Click ‘Setup’
-
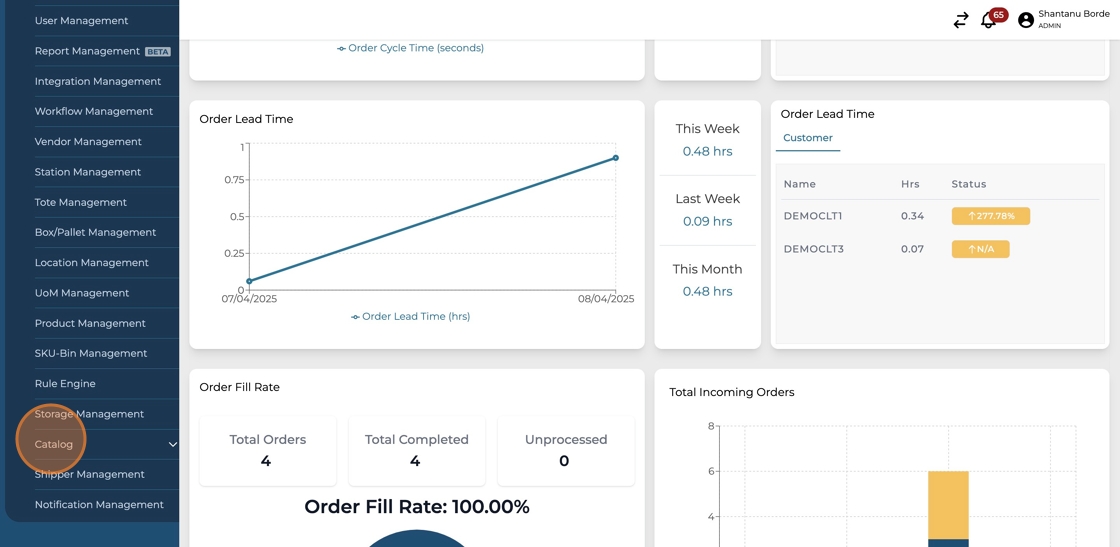
Click ‘Catalog’
-
Click ‘Analytics’
.png?cb=687c4f046833ebe0aa06ec7277cec9d2)
-
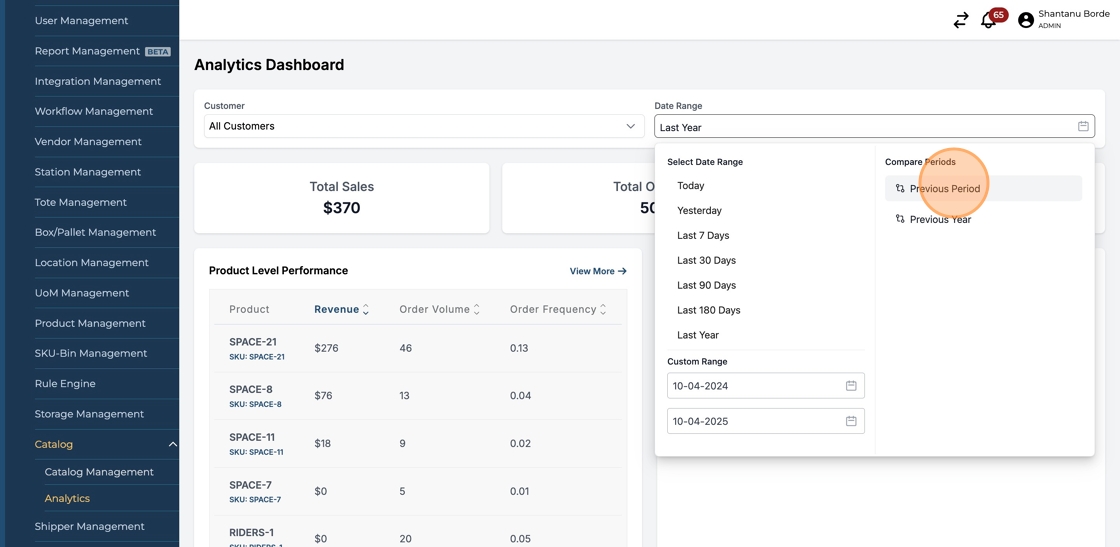
View customer specific analytics by clicking on the customer filter
-
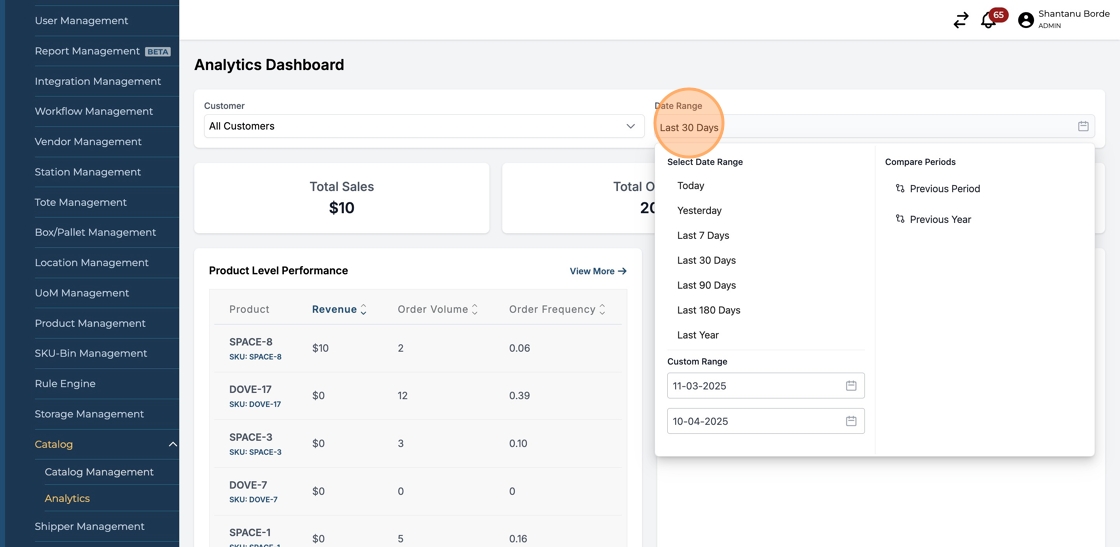
View analytics for any date range through the ‘Date Range’ filter
-
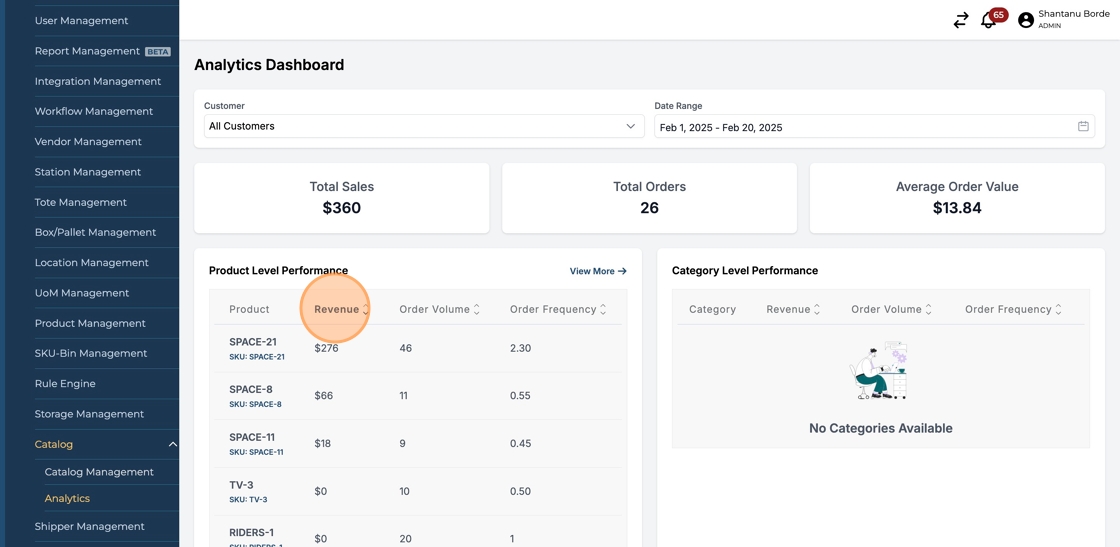
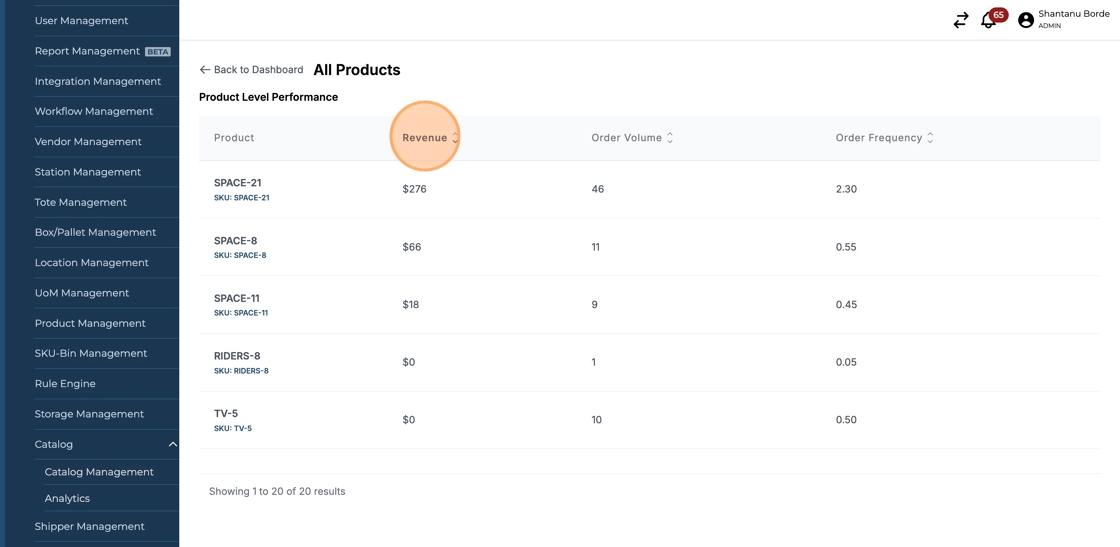
By default, Product Performance section is sorted in descending order according to Revenue. Click on ‘Revenue’ to sort it by ascending order.
-
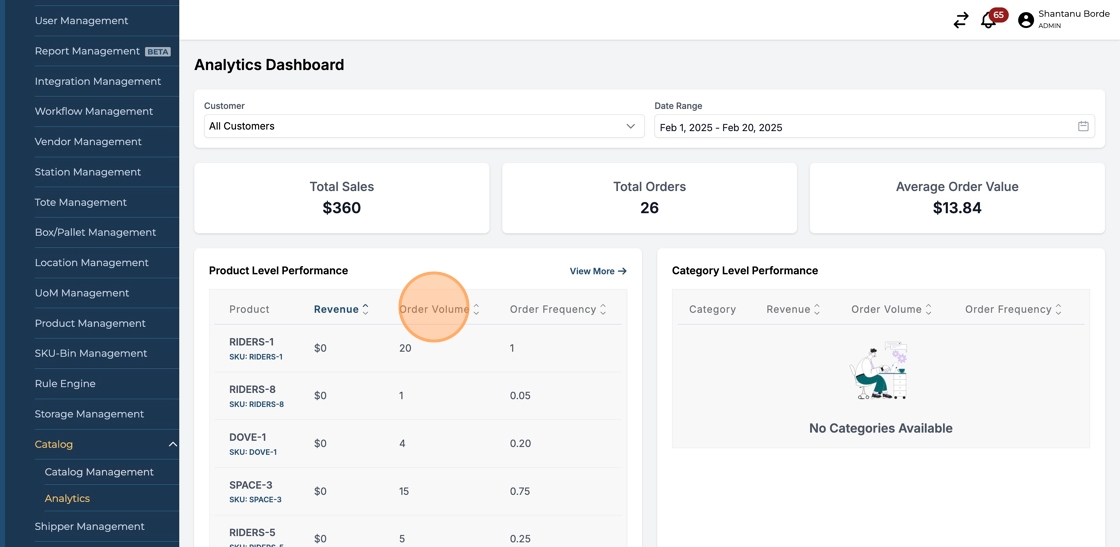
Click on ‘Order Volume’ or ‘Order Frequency’ to sort the products according to these parameters
-
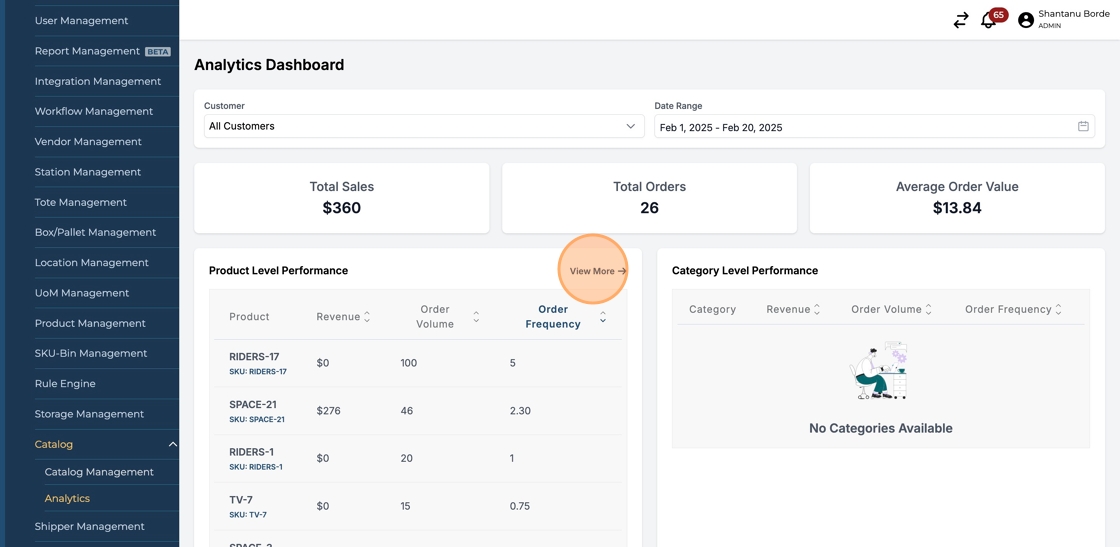
Click on ‘View More’ to view all the products
-
Click on the headers ‘Revenue’, ‘Order Volume’ or ‘Order Frequency’ to sort the products in descending or ascending order according to these parameters
-
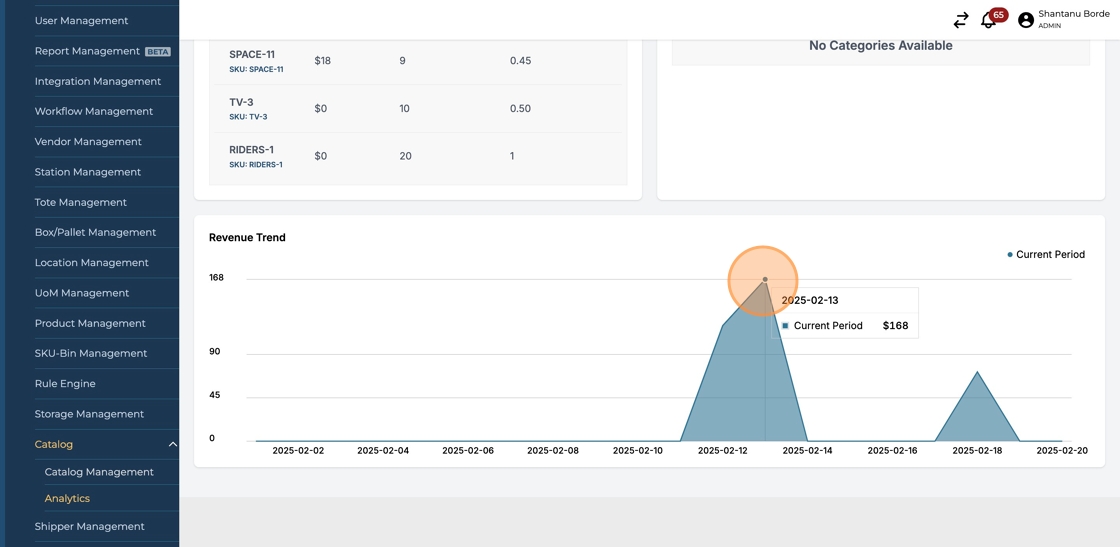
On the home page, scroll to the bottom of the page to view the Revenue Trend for the selected date range
-
Click on the ‘Previous Period’ or ‘Previous Year’ option under the Date Range filter to compare the metrics in two different periods
-
Click on any SKU to view its Sales Overview as well as Pricing Comparison Overview across various catalogs